Situation
An award-winning patissier had a new line of deserts on the shelves of 400 retail stores across the US. To promote the new line, the company was investing heavily in social media marketing. However, the CEO had two problems: a) she had no sight of SKU wise sales velocity in each store (the most important retail metric) b) she could not tell whether the marketing spend was having an impact
Task
We were called to provide performance analysis of each SKU in each geography as well as undertake attribution analysis of marketing $s.
Action
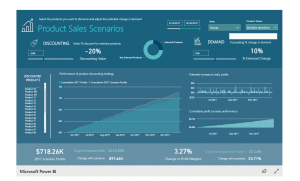
We developed a system of assimilating daily sales data from individual reporting platforms of the retailers. Using this data, we provided daily ‘snap’ performance reports of each SKU to the CEO. These performance reports are analyzed on various dimension of performance eg which price points are most attractive in different zip codes?
We then provided a second layer of performance analysis using demographic and income data by zip code. This data is powerful as it enables to CEO to view performance against true potential.
For marketing attribution, we used facebook api to source media spend data by campaign and geography. We stitched this data with actual sales performance data in each geography to determine RoI of marketing spend.
Result
The CEO now received a fuller view of each store’s performance against the potential of each zip code (inferred from demographic and income data) and the marketing spend. This allows measured data-driven decisions to calibrate marketing strategies and generally drive her team with reduced ambiguity.

Analyzing Sales velocity by price points has enabled the company to develop differentiated pricing strategies in different states and thus take advantage of different demand elasticities. The new pricing strategy has improved margins by 14%.
The real-time sales velocity reports has enabled the company to reduce investments in inventory by 12%.
Interested in knowing more and how we can help you? Call Amit at 0401 45 44 33